Thursday, December 26, 2019

Power BI Notes

Free workspace  dataset refresh max of 8 times a day
Premium workspace dataset refresh 48 times a day
Power BI user roles: Admin, Member, Contributor

Tuesday, December 24, 2019

Switch Statement Power BI


Column =
SWITCH (
    TRUE (),
    'Table'[Field1] = "AAA", "RETAIL",
    'Table'[Field1] = "BBB", "ONLINE",
    SEARCH ( "CCC", 'Table'[Field2], 1, 0 ) = 1, and 'Table'[Field1] like '%yyy%', "RETAIL",
    'Table'[Field2] = "DDD", "RETAIL",
    "UNKNOWN"
)


Saturday, December 21, 2019

Power BI Premium Calculator

Power BI Premium Calculator


AT times it will be confusing what kind of capacity like P1, P2 or P3 need to be purchased for the organization implementing Power BI, Microsoft link below makes it easy to calculate the costs just by entering the number of users:

https://powerbi.microsoft.com/en-us/calculator/

Friday, December 20, 2019

Power BI DAX

What is DAX?

DAX is a collection of functions, operators, and constants that can be used in a formula, or expression, to calculate and return one or more values. Stated more simply, DAX helps you create new information from data already in your model.

Syntax

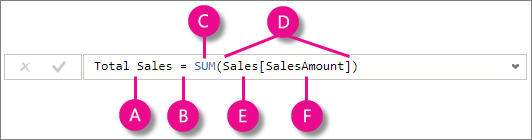
Before you create your own formulas, let’s take a look at DAX formula syntax. Syntax includes the various elements that make up a formula, or more simply, how the formula is written. For example, here's a simple DAX formula for a measure:
DAX formula syntax
This formula includes the following syntax elements:
A. The measure name, Total Sales.
B. The equals sign operator (=), which indicates the beginning of the formula. When calculated, it will return a result.
C. The DAX function SUM, which adds up all of the numbers in the Sales[SalesAmount] column. You’ll learn more about functions later.
D. Parenthesis (), which surround an expression that contains one or more arguments. All functions require at least one argument. An argument passes a value to a function.
E. The referenced table, Sales.
F. The referenced column, [SalesAmount], in the Sales table. With this argument, the SUM function knows on which column to aggregate a SUM.

This name is known as a fully qualified column name in that it includes the column name preceded by the table name.  Columns referenced in the same table don't require the table name be included in the formula, which can make long formulas that reference many columns shorter and easier to read. However, it's a good practice to include the table name in your measure formulas, even when in the same table.
When trying to understand a DAX formula, it's often helpful to break down each of the elements into a language you think and speak every day. For example, you can read this formula as:
For the measure named Total Sales, calculate (=) the SUM of values in the [SalesAmount ] column in the Sales table.

Wednesday, October 16, 2019

Storage mode in Power BI Desktop

Storage mode in Power BI Desktop

In Microsoft Power BI Desktop, you can specify the storage mode of tables. Storage mode lets you control whether Power BI Desktop caches table data in-memory for reports.
Storage mode in Power BI Desktop
Setting the storage mode provides many advantages. You can set storage mode for each table individually in your model. This action enables a single dataset, which provides the following benefits:
  • Query performance: As users interact with visuals in Power BI reports, Data Analysis Expressions (DAX) queries are submitted to the dataset. Caching data into memory by properly setting the storage mode can boost the query performance and interactivity of your reports.
  • Large datasets: Tables that aren't cached don't consume memory for caching purposes. You can enable interactive analysis over large datasets that are too big or expensive to completely cache into memory. You can choose which tables are worth caching, and which aren't.
  • Data refresh optimization: Tables that aren't cached don't need to be refreshed. You can reduce refresh times by caching only the data that's necessary to meet your service level agreements and your business requirements.
  • Near-real time requirements: Tables with near-real time requirements might benefit from not being cached, to reduce data latency.
  • Writeback: Writeback enables business users to explore what-if scenarios by changing cell values. Custom applications can apply changes to the data source. Tables that aren't cached can display changes immediately, which allows instant analysis of the effects.
The storage mode setting in Power BI Desktop is one of three related features:
  • Composite models: Allows a report to have two or more data connections, including DirectQuery connections or Import, in any combination. 
  • Many-to-many relationships: With composite models, you can establish many-to-many relationships between tables. Many-to-many relationships removes requirements for unique values in tables. It also removes prior workarounds, such as introducing new tables only to establish relationships. 
  • Storage mode: You can now specify which visuals require a query to back-end data sources. Visuals that don't require a query are imported even if they're based on DirectQuery. This feature helps improve performance and reduce back-end load. Previously, even simple visuals, such as slicers, initiated queries that were sent to back-end sources. Storage mode is described further in this article.
 Note
You can see the current storage mode by selecting Model view, selecting the table of interest, and then in the Advanced section of the Properties pane, view the Storage mode value.

Composite models in Power BI Desktop


Composite models in Power BI Desktop


Previously in Power BI Desktop, when we used a DirectQuery in a report, no other data connections - whether DirectQuery or Import - were allowed for that report. With composite models, that restriction is removed. A report can seamlessly include data connections from more than one DirectQuery or Import data connection, in any combination you choose.
Below are the three related features in Composite models:
  • Composite models: Allows a report to have multiple data connections, including DirectQuery connections or Import, in any combination. 
  • Many-to-many relationships: With composite models, you can establish many-to-many relationships between tables. This approach removes requirements for unique values in tables. It also removes previous workarounds, such as introducing new tables only to establish relationships.
  • Storage mode: You can now specify which visuals require a query to back-end data sources. Visuals that don't require a query are imported even if they're based on DirectQuery. This feature helps improve performance and reduce back-end load. Previously, even simple visuals such as slicers initiated queries that were sent to back-end sources.

Set the storage mode

Each table in a composite model has a storage mode that indicates whether the table is based on DirectQuery or Import. The storage mode can be viewed and modified in the Property pane. 
To display the storage mode, right-click a table in the Fields list, and then select Properties. The following image shows the storage mode for the SalesTargets table.
Storage mode setting
The storage mode can also be viewed on the tooltip for each table.
Tooltip displaying the storage mode
For any Power BI Desktop file (a .pbix file) that contains some tables from DirectQuery and some Import tables, the status bar displays a storage mode called Mixed. You can click that term in the status bar and easily switch all tables to Import.


Monday, September 16, 2019

Best practices of Power BI datasets

Best practices of Power BI datasets

Checking the refresh history of your datasets regularly is one of the most important best practices you can adopt to ensure that your reports and dashboards use current data. If you discover issues, address them promptly and follow up with data source owners and gateway administrators if necessary.
In addition, consider the following recommendations to establish and maintain reliable data refresh processes for your datasets:
  • Schedule your refreshes for less busy times, especially if your datasets are on Power BI Premium. If you distribute the refresh cycles for your datasets across a broader time window, you can help to avoid peaks that might otherwise overtax available resources. Delays starting a refresh cycle are an indicator of resource overload. If a Premium capacity is completely exhausted, Power BI might even skip a refresh cycle.
  • Keep refresh limits in mind. If the source data changes frequently or the data volume is substantial, consider using DirectQuery/LiveConnect mode instead of Import mode if the increased load at the source and the impact on query performance are acceptable. Avoid constantly refreshing an Import mode dataset. However, DirectQuery/LiveConnect mode has several limitations, such as a one-million-row limit for returning data and a 225 seconds response time limit for running queries, as documented in Use DirectQuery in Power BI Desktop. These limitations might require you to use Import mode nonetheless. For very large data volumes, consider the use of aggregations in Power BI.
  • Verify that your dataset refresh time does not exceed the maximum refresh duration. Use Power BI Desktop to check the refresh duration. If it takes more than 2 hours, consider moving your dataset to Power BI Premium. Your dataset might not be refreshable on shared capacity. Also consider using incremental refresh in Power BI Premium for datasets that are larger than 1GB or take several hours to refresh.
  • Optimize your datasets to include only those tables and columns that your reports and dashboards use. Optimize your mashup queries and, if possible, avoid dynamic data source definitions and expensive DAX calculations. Specifically avoid DAX functions that test every row in a table because of the high memory consumption and processing overhead.
  • Apply the same privacy settings as in Power BI Desktop to ensure that Power BI can generate efficient source queries. Keep in mind that Power BI Desktop does not publish privacy settings. You must manually reapply the settings in the data source definitions after publishing your dataset.
  • Limit the number of visuals on your dashboards, especially if you use row-level security (RLS). As explained earlier in this article, an excessive number of dashboard tiles can significantly increase the refresh duration.
  • Use a reliable enterprise data gateway deployment to connect your datasets to on-premises data sources. If you notice gateway-related refresh failures, such as gateway unavailable or overloaded, follow up with gateway administrators to either add additional gateways to an existing cluster or deploy a new cluster (scale up versus scale out).
  • Use separate data gateways for Import datasets and DirectQuery/LiveConnect datasets so that the data imports during scheduled refresh don't impact the performance of reports and dashboards on top of DirectQuery/LiveConnect datasets, which query the data sources with each user interaction.
  • Ensure that Power BI can send refresh failure notifications to your mailbox. Spam filters might block the email messages or move them into a separate folder where you might not notice them immediately.

Incremental refresh

Incremental refresh

Incremental refresh provides an integral part of having and maintaining large datasets in Power BI Premium. Incremental refresh has many benefits, for example, Refreshes are faster because only data that has changed needs to be refreshed. Refreshes are more reliable because it's unnecessary to maintain long-running connections to volatile data sources. Resource consumption is reduced because less data to refresh reduces overall consumption of memory and other resources. Incremental refresh policies are defined in Power BI Desktop, and applied when published to a workspace in a Premium capacity.
Refresh details

Wednesday, May 22, 2019

CALCULATE DAX Function

CALCULATE DAX Function (Filter)

Evaluates an expression in a context modified by filters.

Syntax

CALCULATE ( <Expression> [, <Filter> [, <Filter> [, … ] ] ] )
PARAMETERATTRIBUTESDESCRIPTION
Expression
The expression to be evaluated.
FilterOptional
Repeatable
A boolean (True/False) expression or a table expression that defines a filter.

Return values

SCALAR A single value of any type.
The value is the result of the expression evaluated in a modified filter context.

Remarks

Every filter argument can be either a filter removal (such as ALL, ALLEXCEPT, ALLNOBLANKROW), a filter restore (ALLSELECTED), or a table expression returning a list of values for one or more columns or for an entire expanded table.
When a filter argument has the form of a predicate with a single column reference, the expression is embedded into a FILTER expression that filters all the values of the referenced column. For example, the predicate shown in the first expression is internally converted in the second expression.
1
2
3
4
5
6
7
8
9
10
11
12
CALCULATE (
    <expression>,
    table[column] = 10
)
 
CALCULATE (
    <expression>,
    FILTER (
        ALL ( table[column] ),
        table[column] = 10
    )
)